
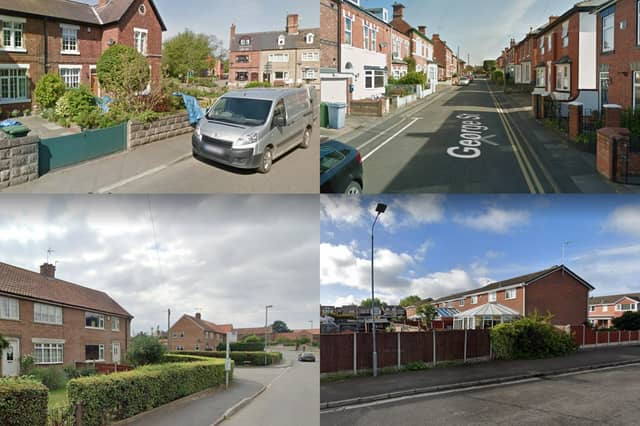

House prices vary dramatically across different parts of the district, the figures from the Office for National Statistics (ONS) show.
Nationally, property prices are continuing to rise.
Monthly figures published as part of HM Land Registry’s House Price Index show how the market has changed over the last year.
Figures for September 2022 show the average property price in England was £307,710 – more than £25,000 more expensive than a year before.
How do property prices compare across Worksop? Here we reveal the most expensive areas in and around the town to buy a property.
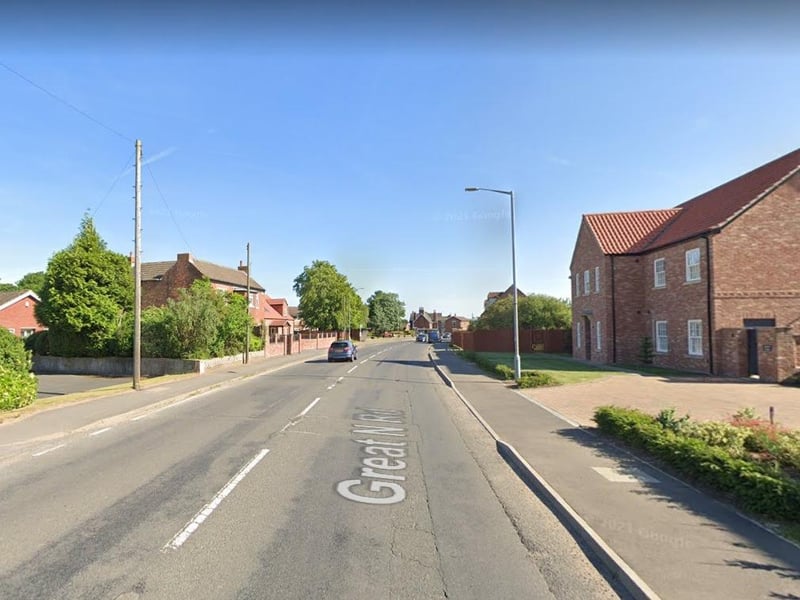
1. Ranskill, Everton & Gringley
The average property price in this area last year was £299,500. Photo: m
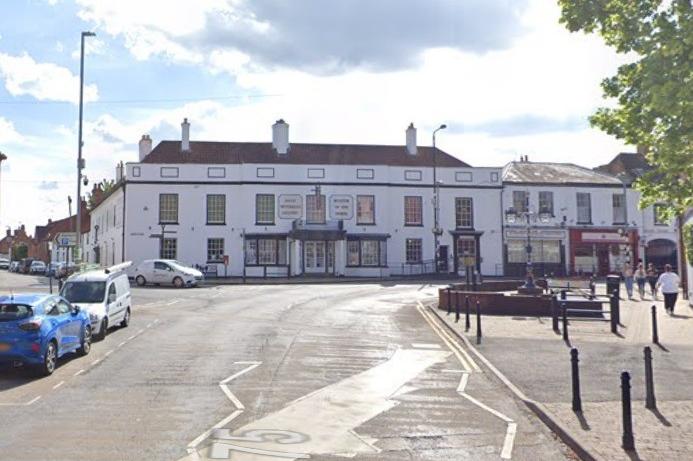
2. Tuxford, Markham & Rampton
The average property price in this area last year was £275,000. Photo: m
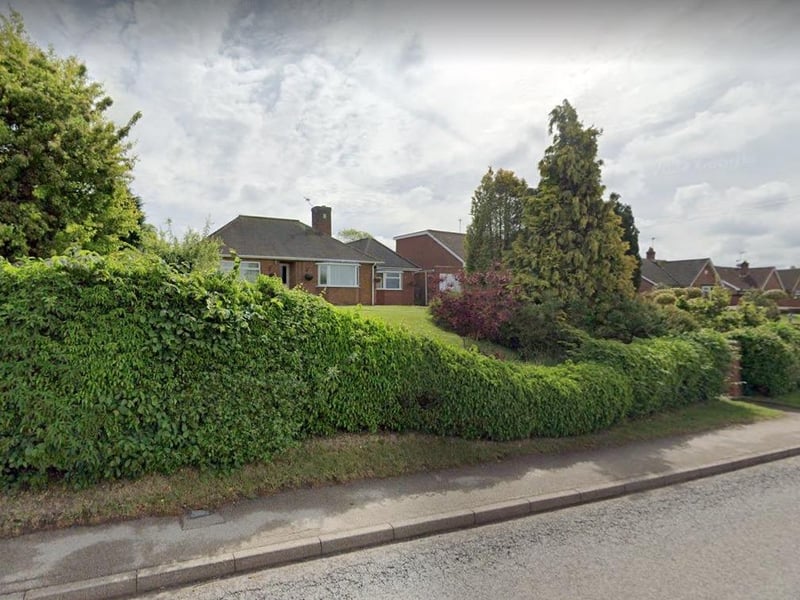
3. Clarborough, Beckingham & Misterton
The average property price in this area last year was £257,975. Photo: m
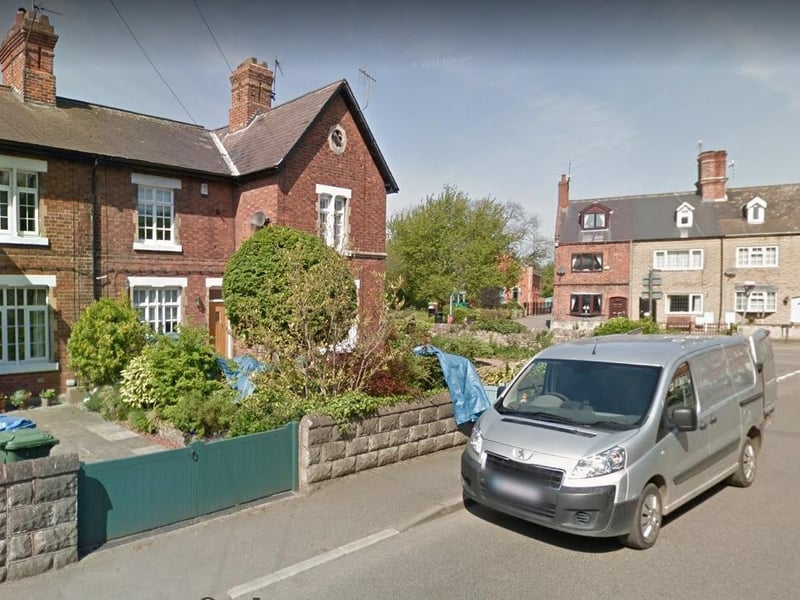
4. Worksop West, Shireoaks & Rhodesia
The average property price in this area last year was £200,000. Photo: m